Revenue Attribution Models: A Practical Guide for Marketers
Posted on
Marketing
Posted at

Revenue attribution connects every marketing touchpoint to closed revenue. There are three families of attribution models: rule-based single-touch, rule-based multi-touch, and data-driven algorithmic. Your data maturity determines which family to start with.
Low data maturity (no CRM linkage, inconsistent UTMs, under 500 monthly conversions): start with first-touch and last-touch in parallel. They are simple to implement and will immediately surface where your funnel is leaking.
Medium data maturity (clean UTM taxonomy, CRM mapped to deals, 500–2,000 monthly conversions): move to rule-based multi-touch. Linear or U-shaped models will give you a more honest picture of which channels contribute across the full buyer journey.
High data maturity (persistent cross-device IDs, CRM-linked revenue events, 2,000+ monthly conversions, touchpoint diversity): pilot algorithmic attribution using Markov chain or Shapley value approaches. Validate with holdout tests before replacing your rule-based baseline.
Immediate next steps by maturity tier:
Low: Audit UTM consistency, define your revenue conversion event in GA4, and run first-touch vs. last-touch side by side for 30 days.
Medium: Map CRM contacts to deals, set a 90-day attribution window, and deploy a U-shaped or linear model in HubSpot or your analytics platform.
High: Confirm conversion volume thresholds, run a Shapley pilot alongside your existing multi-touch model, and build a holdout group to validate lift.
Key Takeaways
The most important step in revenue attribution is matching the model family to your data maturity and business question before choosing any specific model.
Point | Details |
|---|---|
Three model families | Rule-based single-touch, rule-based multi-touch, and algorithmic attribution each suit a different data maturity level. |
Multi-touch impact | Organizations switching to multi-touch reported CAC reductions of 15–30% and ROI improvements up to 40%. |
Staged rollout | Run first-touch, last-touch, and one multi-touch model in parallel for 60 days before committing to any single model. |
Instrumentation first | Clean UTM taxonomy and CRM-to-revenue mapping are required before any model produces reliable outputs. |
Algorithmic threshold | Algorithmic models require 2,000+ monthly conversions and cross-device stitching to produce stable, trustworthy results. |
Table of Contents
What are the types of revenue attribution models?
Why accurate attribution is the foundation of smart budget decisions
The three attribution model families and how they map to your needs
1. First-touch attribution
2. Last-touch attribution
3. Linear attribution
4. Time-decay attribution
5. U-shaped (position-based) attribution
6. W-shaped attribution
7. Data-driven and algorithmic attribution
How do the models compare across key dimensions?
How to choose the right attribution model for your organization
Practical implementation: getting attribution into production
Top attribution pitfalls and how to avoid them
What we've seen work in practice at A&T Digital
The model you choose is the question you're asking
Sources
What are the types of revenue attribution models?
Revenue attribution is the practice of assigning credit for a closed deal or revenue event to the marketing touchpoints that influenced it. The goal is to answer one question: which interactions actually drove the sale?
A typical B2B conversion path might look like this: a prospect clicks a Google Ads search ad (touchpoint 1), reads a blog post via organic search (touchpoint 2), opens a nurture email (touchpoint 3), and then books a demo through a retargeting ad (touchpoint 4).
Tools like GA4, HubSpot, and Salesforce all support attribution reporting, but the accuracy of any model depends on a clean UTM taxonomy and a CRM that maps contacts to closed revenue. Without that linkage, you are attributing credit to channel sessions, not to actual deals.
Why accurate attribution is the foundation of smart budget decisions
Misattribution costs money. When your model is wrong, your budget follows the wrong signal.
Three business outcomes depend directly on attribution accuracy:
Budget allocation: If last-touch shows paid search converting at 3x the rate of display, you will shift budget to paid search. But if display is actually warming up 60% of those prospects before they search, you are defunding a critical channel.
Channel optimization: Attribution data drives bid strategies in Google Ads and Meta campaigns. Feed the wrong signal into a smart bidding algorithm and it will optimize toward the wrong behavior.
LTV/CAC decisions: Knowing which channels attract customers with the highest lifetime value, not just the lowest cost per acquisition, requires connecting attribution data to post-sale revenue in your CRM.
The classic bad-attribution scenario: a team running last-click attribution sees paid search dominating conversions and doubles its search budget. Six months later, pipeline drops because the top-of-funnel content and social campaigns that seeded demand were quietly defunded. Multi-touch adoption reached roughly 47% in 2026, and organizations that switched from single-touch to multi-touch reported CAC reductions of 15–30% and ROI improvements up to 40%.
Attribution also matters beyond the marketing team. Finance and executive stakeholders increasingly want to see revenue tied to channel spend. A defensible attribution model gives you the evidence to justify budget requests and protect high-performing channels from cuts.
The three attribution model families and how they map to your needs
Attribution models fall into three families, each built for a different level of data sophistication and a different set of business questions.
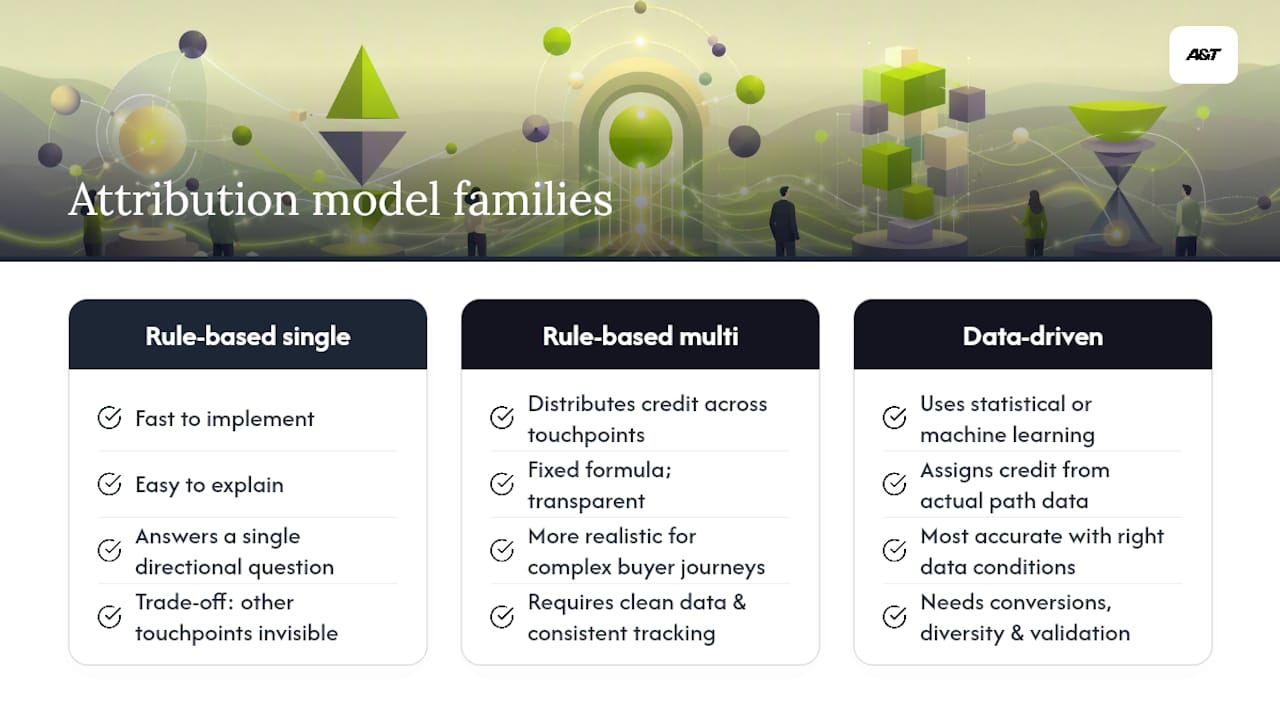
They are fast to implement, easy to explain, and useful for answering a single directional question. The trade-off is a systematic blind spot: every other touchpoint in the journey is invisible.
Rule-based multi-touch models distribute credit across multiple touchpoints using a fixed formula. They are more realistic for complex buyer journeys but require clean data and consistent tracking. The formula is transparent, which makes them easy to defend in stakeholder conversations.
Data-driven algorithmic models use statistical or machine learning methods to assign credit based on actual path data. They are the most accurate when data conditions are right, but they require significant conversion volume, touchpoint diversity, and a validation plan.
One cross-cutting axis worth noting: B2B teams often need account-level attribution, which aggregates all contacts within a buying group into a single account view, rather than contact-level attribution, which treats each person's journey independently. Dreamdata emphasizes account-level attribution as the structurally correct choice for B2B, where multiple stakeholders influence a single deal.
First–touch attribution
If someone clicked a LinkedIn ad six months before signing a contract, LinkedIn gets all the credit.
Pros:
Dead simple to implement and explain
Excellent for measuring top-of-funnel channel performance
Useful when your primary question is "where do our best customers come from?"
Cons:
Ignores every subsequent touchpoint
Systematically overvalues awareness channels
Misleading for long sales cycles with many nurture interactions
Best for: Early-stage companies mapping demand sources, or teams with limited tracking infrastructure. Avoid if your sales cycle exceeds 30 days or you have more than three active channels.
Last–touch attribution
It is the default in most ad platforms and the most widely misused model in performance marketing.
Pros:
Easy to implement; most platforms default to it
Useful for measuring bottom-of-funnel channel efficiency
Answers "what closed the deal?" directly
Cons:
Ignores all awareness and nurture activity
Heavily biases toward branded search and retargeting
Leads teams to defund top-of-funnel channels that are actually driving demand
Best for: Short-cycle e-commerce with one or two touchpoints, or as a baseline to compare against multi-touch models. Single-touch models systematically overvalue one funnel stage, which is why running them alongside a multi-touch model is always more informative than running them alone.
Linear attribution
Linear attribution splits revenue credit equally across every touchpoint in the path.
It is the simplest multi-touch model and a natural first step for teams moving beyond single-touch. The equal weighting is its strength and its weakness: it treats a brand awareness impression the same as a demo-request click.
Best for: Teams that want a quick, defensible multi-touch baseline without committing to a more complex weighting scheme. Works well for B2C brands with short, consistent purchase paths.
Time–decay attribution
Time-decay gives more credit to touchpoints that occurred closer to the conversion event.
This model reflects the intuition that recent interactions are more causally connected to the decision. It suits long B2B sales cycles where early awareness touches are genuinely less influential than late-stage product demos or pricing conversations.

Watch out for: Time-decay can undervalue strong top-of-funnel channels that generate high-quality demand. If your paid social is seeding pipeline that closes 90 days later, time-decay will consistently underreport its contribution.
U–shaped (position–based) attribution
HubSpot's built-in attribution reportingincludes U-shaped as a standard option.
This model reflects the strategic importance of both demand generation and lead capture. It is a strong default for B2B teams that care about both where leads come from and what converts them.
Best for: B2B companies with defined lead-creation events (form fills, demo requests) and moderate sales cycle lengths of 30–90 days.
W–shaped attribution
W-shaped attribution adds a third anchor point: the opportunity-creation stage.
For B2B teams using a CRM like Salesforce or HubSpot, where pipeline stages are clearly defined, W-shaped is often the most accurate rule-based option. It maps directly to the funnel milestones your sales team already tracks.
The following table shows how credit splits across a four-touchpoint path under each rule-based multi-touch model:
Multi-touch models require clean data and technical investment, but the payoff is a more realistic picture of how channels work together across the buyer journey.
Data–driven and algorithmic attribution
Algorithmic attribution replaces fixed rules with statistical models that learn from your actual conversion path data. Three approaches dominate in practice.
Markov chain attribution models the conversion path as a sequence of states. It calculates the probability of conversion from each state and then measures how much that probability drops when a specific channel is removed. Channels that, when removed, cause the biggest drop in conversion probability receive the most credit.

Shapley value attribution borrows from cooperative game theory. It asks: across every possible combination of channels, what is the average marginal contribution of each channel to the conversion outcome? It is computationally intensive but theoretically the fairest distribution of credit.
ML and regression models go further, incorporating path timing, sequence, frequency, and user-level signals to predict conversion probability. They can surface patterns that rule-based models miss entirely, including non-linear interactions between channels.
Data checklist before adopting algorithmic attribution:
Minimum 2,000 monthly conversions with sufficient path diversity
At least 3–5 distinct touchpoint types in your data
CRM linkage connecting contacts to closed revenue
Cross-device stitching or a persistent user identifier
At least 90 days of clean historical path data
Validation tips: Run your algorithmic model in parallel with your existing rule-based model for 60–90 days. Use holdout testing to measure whether the model's recommendations actually improve revenue when acted on. Run sensitivity checks: if small changes in input data produce large swings in credit allocation, the model is unstable.
AI attribution can surface patterns rule-based models miss, but it requires sufficient conversion volume and touchpoint diversity and must be validated for explainability and stability. When presenting results to finance or sales stakeholders, lead with the business outcome, not the algorithm.
Pro Tip: Don't abandon your rule-based model when you adopt algorithmic attribution. Run both in parallel and treat disagreements between them as signals worth investigating. When a Shapley model and your W-shaped model agree on a channel's value, you have high confidence. When they disagree sharply, dig into the path data before making budget decisions.
How do the models compare across key dimensions?
Model | Credit method | Complexity | Data requirements | Best for | Common blind spots | Validation ease |
|---|---|---|---|---|---|---|
First-touch | 100% first-touch | Low | Minimal | Awareness measurement | Ignores nurture | Easy |
Last-touch | 100% last-touch | Low | Minimal | Short-cycle e-commerce | Ignores top-of-funnel | Easy |
Linear | Equal split | Low-medium | Clean UTMs | Multi-channel baseline | Treats all touches equally | Easy |
Time-decay | Recency-weighted | Medium | Clean UTMs + timestamps | Long B2B cycles | Undervalues early demand | Moderate |
U-shaped | 40/40/20 | Medium | CRM + lead events | B2B lead gen | Middle-touch blind spot | Moderate |
W-shaped | 30/30/30/— | Medium-high | CRM + pipeline stages | B2B with defined funnel | Requires clean stage data | Moderate |
Algorithmic | Data-derived | High | 2,000+ conversions, cross-device | Mature data orgs | Explainability, instability | Hard |
To use this matrix in a stakeholder conversation: start with your primary business question (awareness vs. conversion vs. pipeline), match it to the "best for" column, then check whether your data requirements column is achievable. Matching the model to the business question is the single most important step B2B teams skip.
How to choose the right attribution model for your organization
No single model is universally correct. The right choice depends on what question you are trying to answer and what your data can actually support.
Define your primary business question. Are you trying to understand where new customers come from (first-touch), what closes deals (last-touch), or how channels work together across the full journey (multi-touch)? The question determines the model.
Assess your sales cycle length. Cycles under 14 days can often be served by last-touch. Cycles of 30–90 days need at least a U-shaped or W-shaped model. Cycles over 90 days with multiple stakeholders need account-level multi-touch or algorithmic attribution.
Audit your data maturity. Check UTM consistency across all paid channels, confirm CRM contacts are mapped to closed deals, and count your monthly conversion volume. Attribution model selection varies by company size and maturity, and starting with a model your data cannot support produces misleading outputs.
Check your channel mix. If you run only two channels, linear attribution is sufficient. If you run five or more channels with overlapping audiences, you need a model that can distinguish their individual contributions.
Decide: account-level or contact-level? B2B teams with buying committees should aggregate touchpoints at the account level, not the individual contact level. A deal influenced by three stakeholders across 12 touchpoints looks very different at the account level than at the contact level.
Ask your analytics team these questions before choosing: Do we have persistent user IDs across sessions? Are our UTM parameters applied consistently across every paid channel? Is revenue mapped to the correct CRM deal stage?
Run a staged rollout. Start by running first-touch, last-touch, and one multi-touch model in parallel for 60 days. Compare where they agree and where they diverge. Divergence points are your most valuable insights. Once you have a stable multi-touch baseline, pilot an algorithmic model if your conversion volume qualifies. Mid-market B2B teams should advance to algorithmic pilots only once data hygiene and conversion volume thresholds are met.
Practical implementation: getting attribution into production
Getting attribution right is an instrumentation problem before it is a modeling problem. Follow these steps in order.
Define your revenue conversion event. Be specific: is it a closed-won deal in Salesforce, a subscription activation, or a purchase confirmation? Every model depends on this definition being consistent.
Standardize your UTM taxonomy. Agree on a naming convention for
utm_source,utm_medium, andutm_campaignacross every paid channel. Inconsistent UTMs are the single most common cause of attribution failure. A&T Digital's paid advertising terminology guide covers UTM standards in detail.Implement persistent identifiers. Use a first-party cookie or a server-side user ID to stitch sessions across devices. Client-side cookies alone are insufficient for multi-session attribution.
Map CRM contacts to accounts and deals. Every contact record should link to an account and a deal with a closed-won date and revenue value. This is the bridge between marketing touchpoints and actual revenue.
Set your attribution window. A 30-day window is standard for B2C. B2B cycles often need 90–180 days. Mismatched windows will systematically exclude touchpoints that occurred before the window opens.
Configure deduplication rules. Decide how to handle duplicate conversion events (e.g., a contact who fills out two forms). Without deduplication, revenue totals will be inflated.
Run validation tests after go-live. Pull a sample of 20–30 closed deals and manually trace their touchpoint paths. Confirm the attribution model is assigning credit to the channels you know were involved. Run channel-level sanity checks: if a channel drove zero attributed revenue but you know it generated leads, something is broken upstream.
For teams using GA4 alongside a CRM, analytics-driven instrumentation is the foundation that makes every attribution model more reliable.
The following table shows the minimum instrumentation required for each model family:
Top attribution pitfalls and how to avoid them
Even well-designed attribution systems break down in predictable ways. Here are the six most common failure modes and a one-line fix for each.
Poor data hygiene: Inconsistent UTMs or missing campaign tags corrupt every model. Fix: enforce a UTM naming convention and audit it monthly.
Cross-device fragmentation: A prospect who researches on mobile and converts on desktop looks like two separate users without a persistent ID. Fix: implement server-side tracking or a first-party identity solution.
Walled gardens: Meta, Google, and TikTok all report conversions using their own attribution logic, which typically inflates their individual contribution. Fix: use a neutral third-party attribution tool to reconcile platform-reported data against CRM revenue.
Over-reliance on last-click: Defaulting to last-click in ad platform reporting will systematically defund top-of-funnel channels. Fix: always compare last-click platform data against a multi-touch model before making budget decisions.
Small-sample noise: Algorithmic models trained on fewer than 2,000 monthly conversions produce unstable outputs. Fix: stay with rule-based models until conversion volume is sufficient.
Incorrect revenue mapping: Attributing revenue to the wrong CRM stage (e.g., pipeline value instead of closed-won revenue) inflates results. Fix: define the revenue event as closed-won only and validate it against your finance team's numbers.
Privacy changes and the deprecation of third-party cookies reduce the observable touchpoint data available to any attribution model. The practical response is to invest in first-party data collection and server-side event tracking, which are more durable than browser-based cookie tracking.
What weʼve seen work in practice at A&T agency
Attribution is not a theoretical exercise. Here is what we see consistently across client engagements.
Short-cycle e-commerce example: A direct-to-consumer brand was running last-touch attribution and concluded that branded search was its top-performing channel. Last-touch had been crediting branded search for demand that Meta actually generated.
Long-cycle B2B lead-gen example: A B2B SaaS client with a 90-day average sales cycle was using linear attribution. The model was giving equal credit to a single LinkedIn impression and a product demo. We moved to W-shaped attribution mapped to their Salesforce pipeline stages. The result: content syndication, which had appeared mid-funnel and invisible under linear, emerged as a significant opportunity-creation driver. The team reallocated budget accordingly and saw pipeline quality improve.
Our agency checklist for new attribution engagements:
Audit UTM consistency across all active paid channels before touching any model
Confirm CRM deal stages map to real revenue events, not pipeline estimates
Run first-touch and last-touch in parallel for 30 days as a baseline before introducing multi-touch
Flag any channel spending more than 15% of budget that has zero attributed touchpoints (a tracking gap, not a performance gap)
Propose an algorithmic pilot only after 90 days of clean multi-touch data and confirmed conversion volume
For teams ready to connect attribution insights directly to paid media execution, our performance marketing approach ties attribution data to campaign optimization at every stage. Analytics-driven ROI improvements are consistently larger for teams that close the loop between attribution reporting and budget decisions.
Ready to connect your attribution data to paid media that actually performs? A&T Digital builds and manages Google Ads campaigns and Meta Ads campaigns with attribution-informed strategy built in from day one. No unnecessary meetings. Just campaigns that convert.
The model you choose is the question youʼre asking
Most attribution guides treat model selection as a technical decision. It is not. It is a strategic one.
The conventional advice says: "use multi-touch attribution because it's more accurate." That is true in the abstract. But accuracy relative to what? A W-shaped model is more accurate than last-touch for a 90-day B2B sales cycle. It is no more useful than a coin flip if your CRM stage data is unreliable or your conversion volume is too low to produce stable weights.
What actually matters is this: every attribution model is a hypothesis about how your buyers make decisions. First-touch says the first impression is what counts. Last-touch says the final nudge is what counts. W-shaped says three specific milestones are what count. When you choose a model, you are choosing which hypothesis to act on. That choice should be driven by what you know about your buyers, not by what your analytics platform defaults to.
The teams that get the most value from attribution are not the ones running the most sophisticated models. They are the ones who run multiple models in parallel, treat disagreements between models as data, and use that tension to ask better questions about their buyer journey. A Shapley model that disagrees with your W-shaped model on the value of paid social is not a problem to resolve. It is a prompt to look at the actual path data and understand why.
Start simple. Stay skeptical. And never let a single model's output drive a budget decision without at least one other model to check it against.